This guide walks through the full setup end-to-end: creating the performance counter alert, adding it to a PowerShell script that sends you a notification email, and testing the whole chain so you can be confident it will work when you actually need it.
The Alert Chain at a Glance
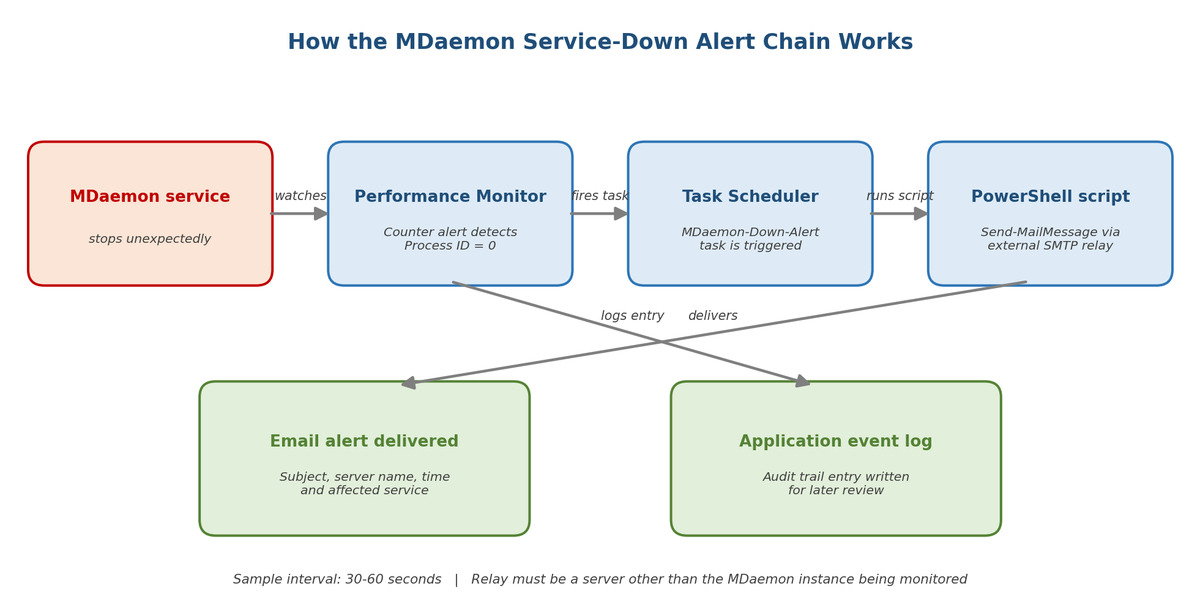
Before diving into the configuration, here is the overall flow you will be building. Each box is a separate piece of Windows you will configure, in the order you’ll configure them.
Why Performance Monitor?
Performance Monitor (perfmon) is part of every supported version of Windows Server. It can watch a counter — such as whether the MDaemon process is running — and trigger an action when that counter crosses a threshold. Combined with Task Scheduler and a short PowerShell script, it becomes a lightweight, zero-cost alerting system that runs natively on the mail server itself.
The approach covered here works for:
- The core MDaemon service
- MDaemon Webmail (WorldClient)
- MDaemon Remote Administration
- MDaemon ActiveSync
- MDaemon XMPP Server
- Security Gateway components, where applicable
Before You Begin
You’ll need the following in place:
- Administrative access to the Windows Server running MDaemon
- A working SMTP server other than the MDaemon server you’re monitoring — if MDaemon is the service that went down, you can’t send the alert through it.
- PowerShell 5.1 or later (included with Windows Server 2016 and newer)
- An idea of which MDaemon services are business-critical in your environment
Step 1: Identify the Process You Want to Watch
Performance Monitor tracks processes by their executable name (without the .exe extension). For the most common MDaemon services, those are:
MDaemon— the core mail engineWorldClient— webmailWebAdmin— remote administrationMDSpamD— ActiveSync serviceWCXMPPServer— XMPP/chat service
Open Task Manager on your MDaemon server and confirm the exact process name under the Details tab. If you’re monitoring several at once, you’ll repeat the steps below for each one.
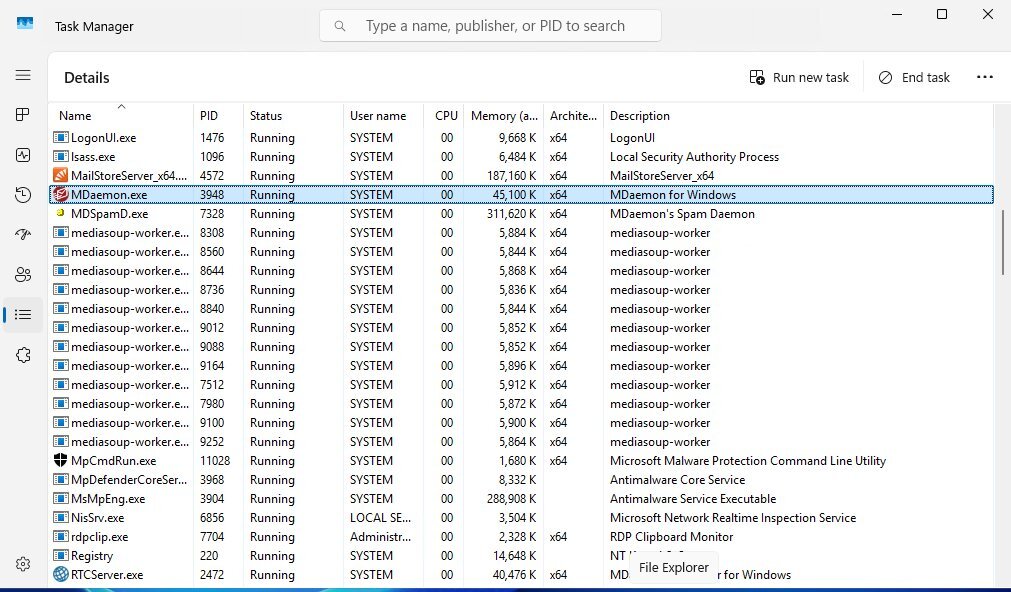
.exe (“MDaemon”) is what Performance Monitor will track.Step 2: Create the Alert Email Script
Before building the alert itself, create the PowerShell script it will run. Save the following to C:\Scripts\Send-MDaemonAlert.ps1, adjusting the parameters for your environment:
param(
    [string]$ServiceName = "MDaemon"
)

$smtpServer = "smtp.yourrelay.com"
$smtpPort   = 587
$smtpUser   = "alerts@example.com"
$smtpPass   = ConvertTo-SecureString "YOUR-APP-PASSWORD" -AsPlainText -Force
$credential = New-Object System.Management.Automation.PSCredential($smtpUser, $smtpPass)

$from    = "alerts@example.com"
$to      = "admin@example.com"
$subject = "[ALERT] MDaemon service '$ServiceName' is DOWN on $env:COMPUTERNAME"
$body    = @"
The Performance Monitor alert on $env:COMPUTERNAME has detected that the
MDaemon-related process '$ServiceName' is no longer running.

Time detected : $(Get-Date -Format 'yyyy-MM-dd HH:mm:ss')
Server        : $env:COMPUTERNAME
Service       : $ServiceName

Please investigate immediately.
"@

Send-MailMessage -From $from -To $to -Subject $subject -Body $body `
    -SmtpServer $smtpServer -Port $smtpPort -UseSsl `
    -Credential $credential
A few important notes:
- Storing the password in plaintext inside the script is convenient but not ideal. For a production environment, export the credential with
Export-CliXmland import it at runtime, or use Windows Credential Manager. Send-MailMessageis marked as legacy by Microsoft but remains functional and is the simplest option for a script like this. If you prefer a modern alternative, install theSend-MailKitMessagemodule from the PowerShell Gallery and swap the cmdlet in.
Critical: don’t relay through MDaemon itself.
Point the relay at something other than the MDaemon server you’re monitoring. If MDaemon is the service that went down, an alert relayed through it will never leave the server. This is the single most common mistake people make with this setup.
Test the script on its own before moving on:
powershell.exe -ExecutionPolicy Bypass -File "C:\Scripts\Send-MDaemonAlert.ps1" -ServiceName "MDaemon (test)"
If the test email arrives, you’re ready to continue.
Step 3: Wrap the Script in a Scheduled Task
Performance Monitor alerts trigger scheduled tasks, not scripts directly. Create the task Performance Monitor will call:
- Open Task Scheduler (
taskschd.msc). - In the Actions pane, choose Create Task (not Basic Task).
- On the General tab, name it
MDaemon-Down-Alert. Set it to Run whether user is logged on or not and check Run with highest privileges. - Skip the Triggers tab — Performance Monitor supplies the trigger.
- On the Actions tab, click New and configure:
- Action: Start a program
- Program/script:
powershell.exe - Add arguments:
-ExecutionPolicy Bypass -File "C:\Scripts\Send-MDaemonAlert.ps1" -ServiceName "MDaemon"
- On the Settings tab, untick Stop the task if it runs longer than so a slow relay doesn’t cut the email off.
- Click OK and supply the service account credentials when prompted.
Run the task manually once from Task Scheduler to confirm it sends the email correctly.
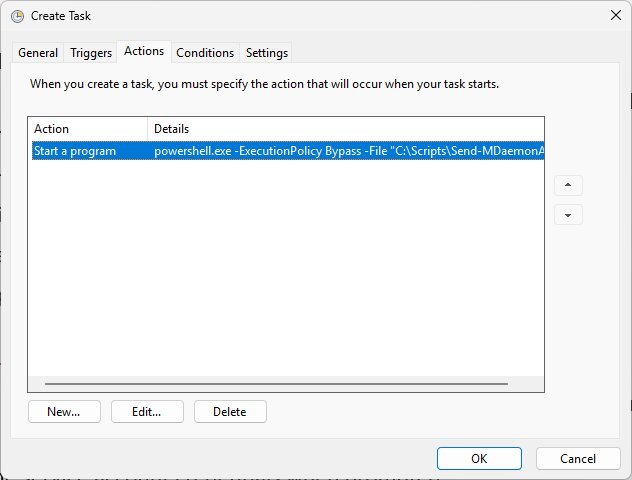
powershell.exe with the script path as the -File argument.Step 4: Create the Performance Counter Alert
Now the core piece: the alert that watches the process and triggers the task.
- Open Performance Monitor (
perfmon.msc). - In the left pane, expand Data Collector Sets → User Defined.
- Right-click User Defined and choose New → Data Collector Set.
- Name it
MDaemon Service Alert, select Create manually (Advanced), and click Next. - Choose Performance Counter Alert and click Next.
- Click Add, expand Process, select the counter ID Process, and under Instances of selected object pick
MDaemon(or whichever process you’re monitoring). Click Add, then OK. - Set Alert when to Below, and Limit to
1. This means “fire the alert whenever the process has no valid ID — in other words, when it isn’t running.” - Click Next, keep the default save location, and choose Finish.
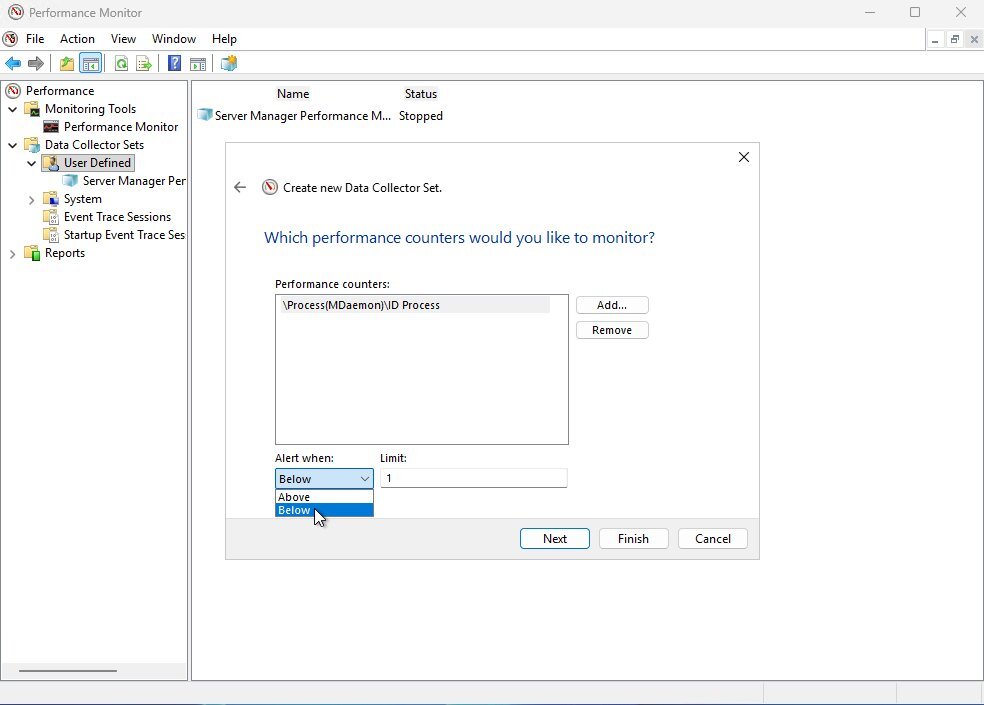
\Process(MDaemon)\ID Process counter and Alert when: Below 1.By default the alert only checks every 15 seconds. You can tighten or loosen this:
- In User Defined, click
MDaemon Service Alert. - In the right pane, right-click
DataCollector01and open Properties. - On the Alerts tab, confirm the counter and threshold.
- On the Alert Action tab, tick Log an entry in the application event log so you have an audit trail even when the email succeeds.
- On the Alert Task tab, enter
MDaemon-Down-Alert(the task you created in Step 3). In Task arguments, you can passMDaemonor another label so the email identifies the specific service. - Set Sample interval (on the parent Data Collector Set’s properties) to something sensible — every 30 or 60 seconds is usually right. Too aggressive a sample adds overhead; too relaxed and you’ll wait minutes to find out.
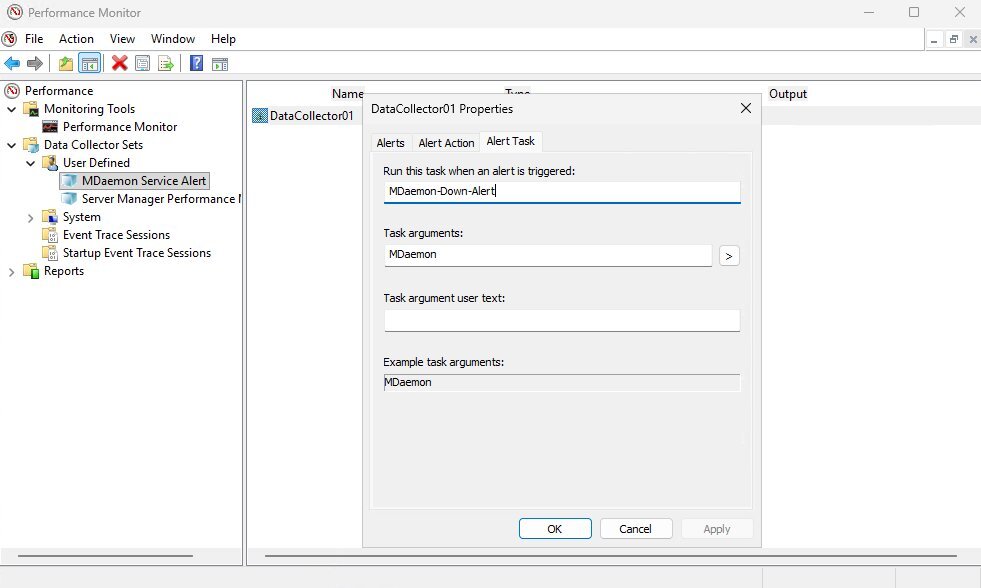
DataCollector01 Properties — Alert Task tab, pointing at the MDaemon-Down-Alert scheduled task with “MDaemon” passed as the task argument.Right-click the MDaemon Service Alert data collector set and choose Start. To have the alert survive reboots, open its properties and, on the Schedule tab, add a schedule that starts the collector when you want it running, or simply configure it to auto-start via the collector set’s Properties → General tab.
Step 5: Repeat for Each Service You Care About
The same pattern works for Webmail (WorldClient), MDRemote, ActiveSync, and any other component. You can either:
- Create one data collector set per service, each pointing at a task that passes a different
-ServiceNameargument, or - Create a single data collector set with multiple counters, one per process, and let the script log which one fired.
Most administrators find the one-per-service approach easier to reason about when something goes wrong.
Step 6: Test It End-to-End
To test, open the Services console (services.msc), and stop the MDaemon service. Within your configured sample interval you should see:
- An entry in the Application event log from the
Diagnosis-PLAsource indicating the alert fired - An email in your administrator inbox from the PowerShell script
- The Task Scheduler history for
MDaemon-Down-Alertshowing a successful run
Start the service again afterwards. If any link in the chain failed, the event log on the MDaemon server is usually the fastest place to find out which one.
A Few Hardening Tips
Once the basics are working, a handful of small improvements make a big difference in production:
- Configure Windows Service Recovery as a first line of defense. In
services.msc, open the MDaemon service’s properties, go to Recovery, and set the first and second failures to Restart the Service. This often resolves the outage before your alert ever needs to fire — but keep the alert anyway, because you want to know it happened. - Send alerts to a distribution list, not a single mailbox. If the only person who gets the alert is on vacation, the alert is effectively useless.
- Consider a second channel. Email is fine for business hours but easy to miss overnight. The same PowerShell script can push to a Microsoft Teams webhook, trigger an SMS via Twilio, or post to a Slack channel in just a few extra lines.
- Monitor the monitor. Configure a weekly test; even just a scheduled run of the script with a “this is a test” subject, so you know the relay credentials haven’t expired and the script still runs.
Wrapping Up
With Performance Monitor, Task Scheduler, and a short PowerShell script, you get the same “tell me the moment something breaks” behavior that dedicated monitoring suites provide, using only what’s already installed on the server. It takes about fifteen minutes to set up the first time and a couple of minutes to extend to each additional MDaemon component.
If MDaemon is central to how your organization communicates — and for most of our customers, it is — that investment pays for itself the first time it catches an outage before your users do.